
Books for Arab American Heritage Month
In honor of Arab American Heritage Month in April, we are sharing books by Arab and Arab American authors that share their culture, history, and personal lives.


In honor of Arab American Heritage Month in April, we are sharing books by Arab and Arab American authors that share their culture, history, and personal lives.
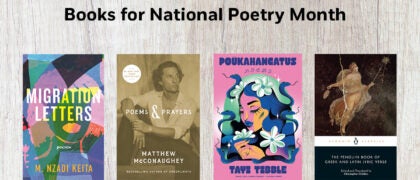
For National Poetry Month in April, we are sharing poetry collections and books about poetry by authors who have their own stories to tell. These poets delve into history, reimagine the present, examine poetry itself—from traditional poems many know and love to poems and voices that are new and original.