Download high-resolution image
Listen to a clip from the audiobook
audio play button
0:00
0:00

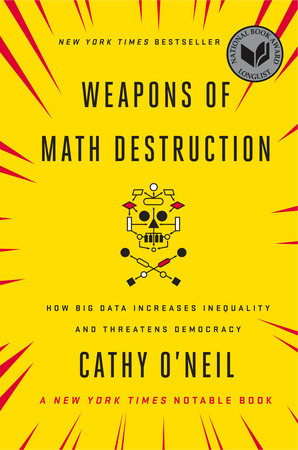
Weapons of Math Destruction

How Big Data Increases Inequality and Threatens Democracy

Listen to a clip from the audiobook
audio play button
0:00
0:00
NEW YORK TIMES BESTSELLER • A former Wall Street quant sounds the alarm on Big Data and the mathematical models that threaten to rip apart our social fabric—with a new afterword
 
“A manual for the twenty-first-century citizen . . . relevant and urgent.”—Financial Times
 
NATIONAL BOOK AWARD LONGLIST • NAMED ONE OF THE BEST BOOKS OF THE YEAR BY The New York Times Book Review The Boston GlobeWired • Fortune • Kirkus Reviews • The Guardian • Nature • On Point
 
We live in the age of the algorithm. Increasingly, the decisions that affect our lives—where we go to school, whether we can get a job or a loan, how much we pay for health insurance—are being made not by humans, but by machines. In theory, this should lead to greater fairness: Everyone is judged according to the same rules.
 
But as mathematician and data scientist Cathy O’Neil reveals, the mathematical models being used today are unregulated and uncontestable, even when they’re wrong. Most troubling, they reinforce discrimination—propping up the lucky, punishing the downtrodden, and undermining our democracy in the process. Welcome to the dark side of Big Data.
1

BOMB PARTS
What Is a Model? 

It was a hot August afternoon in 1946. Lou Boudreau, the player-manager of the Cleveland Indians, was having a miserable day. In the first game of a doubleheader, Ted Williams had almost single-handedly annihilated his team. Williams, perhaps the game’s greatest hitter at the time, had smashed three home runs and driven home eight. The Indians ended up losing 11 to 10.

Boudreau had to take action. So when Williams came up for the first time in the second game, players on the Indians’ side started moving around. Boudreau, the shortstop, jogged over to where the second baseman would usually stand, and the second baseman backed into short right field. The third baseman moved to his left, into the shortstop’s hole. It was clear that Boudreau, perhaps out of desperation, was shifting the entire orientation of his defense in an attempt to turn Ted Williams’s hits into outs.

In other words, he was thinking like a data scientist. He had analyzed crude data, most of it observational: Ted Williams usually hit the ball to right field. Then he adjusted. And it worked. Fielders caught more of Williams’s blistering line drives than before (though they could do nothing about the home runs sailing over their heads).

If you go to a major league baseball game today, you’ll see that defenses now treat nearly every player like Ted Williams. While Boudreau merely observed where Williams usually hit the ball, managers now know precisely where every player has hit every ball over the last week, over the last month, throughout his career, against left-handers, when he has two strikes, and so on. Using this historical data, they analyze their current situation and calculate the positioning that is associated with the highest probability of success. And that sometimes involves moving players far across the field.

Shifting defenses is only one piece of a much larger question: What steps can baseball teams take to maximize the probability that they’ll win? In their hunt for answers, baseball statisticians have scrutinized every variable they can quantify and attached it to a value. How much more is a double worth than a single? When, if ever, is it worth it to bunt a runner from first to second base?

The answers to all of these questions are blended and combined into mathematical models of their sport. These are parallel universes of the baseball world, each a complex tapestry of probabilities. They include every measurable relationship among every one of the sport’s components, from walks to home runs to the players themselves. The purpose of the model is to run different scenarios at every juncture, looking for the optimal combinations. If the Yankees bring in a right-handed pitcher to face Angels slugger Mike Trout, as compared to leaving in the current pitcher, how much more likely are they to get him out? And how will that affect their overall odds of winning?

Baseball is an ideal home for predictive mathematical modeling. As Michael Lewis wrote in his 2003 bestseller, Moneyball, the sport has attracted data nerds throughout its history. In decades past, fans would pore over the stats on the back of baseball cards, analyzing Carl Yastrzemski’s home run patterns or comparing Roger Clemens’s and Dwight Gooden’s strikeout totals. But starting in the 1980s, serious statisticians started to investigate what these figures, along with an avalanche of new ones, really meant: how they translated into wins, and how executives could maximize success with a minimum of dollars.

“Moneyball” is now shorthand for any statistical approach in domains long ruled by the gut. But baseball represents a healthy case study—and it serves as a useful contrast to the toxic models, or WMDs, that are popping up in so many areas of our lives. Baseball models are fair, in part, because they’re transparent. Everyone has access to the stats and can understand more or less how they’re interpreted. Yes, one team’s model might give more value to home run hitters, while another might discount them a bit, because sluggers tend to strike out a lot. But in either case, the numbers of home runs and strikeouts are there for everyone to see.

Baseball also has statistical rigor. Its gurus have an immense data set at hand, almost all of it directly related to the performance of players in the game. Moreover, their data is highly relevant to the outcomes they are trying to predict. This may sound obvious, but as we’ll see throughout this book, the folks building WMDs routinely lack data for the behaviors they’re most interested in. So they substitute stand-in data, or proxies. They draw statistical correlations between a person’s zip code or language patterns and her potential to pay back a loan or handle a job. These correlations are discriminatory, and some of them are illegal. Baseball models, for the most part, don’t use proxies because they use pertinent inputs like balls, strikes, and hits.

Most crucially, that data is constantly pouring in, with new statistics from an average of twelve or thirteen games arriving daily from April to October. Statisticians can compare the results of these games to the predictions of their models, and they can see where they were wrong. Maybe they predicted that a left-handed reliever would give up lots of hits to right-handed batters—and yet he mowed them down. If so, the stats team has to tweak their model and also carry out research on why they got it wrong. Did the pitcher’s new screwball affect his statistics? Does he pitch better at night? Whatever they learn, they can feed back into the model, refining it. That’s how trustworthy models operate. They maintain a constant back-and-forth with whatever in the world they’re trying to understand or predict. Conditions change, and so must the model.

Now, you may look at the baseball model, with its thousands of changing variables, and wonder how we could even be comparing it to the model used to evaluate teachers in Washington, D.C., schools. In one of them, an entire sport is modeled in fastidious detail and updated continuously. The other, while cloaked in mystery, appears to lean heavily on a handful of test results from one year to the next. Is that really a model?

The answer is yes. A model, after all, is nothing more than an abstract representation of some process, be it a baseball game, an oil company’s supply chain, a foreign government’s actions, or a movie theater’s attendance. Whether it’s running in a computer program or in our head, the model takes what we know and uses it to predict responses in various situations. All of us carry thousands of models in our heads. They tell us what to expect, and they guide our decisions.

Here’s an informal model I use every day. As a mother of three, I cook the meals at home—my husband, bless his heart, cannot remember to put salt in pasta water. Each night when I begin to cook a family meal, I internally and intuitively model everyone’s appetite. I know that one of my sons loves chicken (but hates hamburgers), while another will eat only the pasta (with extra grated parmesan cheese). But I also have to take into account that people’s appetites vary from day to day, so a change can catch my model by surprise. There’s some unavoidable uncertainty involved.

The input to my internal cooking model is the information I have about my family, the ingredients I have on hand or I know are available, and my own energy, time, and ambition. The output is how and what I decide to cook. I evaluate the success of a meal by how satisfied my family seems at the end of it, how much they’ve eaten, and how healthy the food was. Seeing how well it is received and how much of it is enjoyed allows me to update my model for the next time I cook. The updates and adjustments make it what statisticians call a “dynamic model.”

Over the years I’ve gotten pretty good at making meals for my family, I’m proud to say. But what if my husband and I go away for a week, and I want to explain my system to my mom so she can fill in for me? Or what if my friend who has kids wants to know my methods? That’s when I’d start to formalize my model, making it much more systematic and, in some sense, mathematical. And if I were feeling ambitious, I might put it into a computer program.

Ideally, the program would include all of the available food options, their nutritional value and cost, and a complete database of my family’s tastes: each individual’s preferences and aversions. It would be hard, though, to sit down and summon all that informationoff the top of my head. I’ve got loads of memories of people grabbing seconds of asparagus or avoiding the string beans. But they’re all mixed up and hard to formalize in a comprehensive list.

The better solution would be to train the model over time, entering data every day on what I’d bought and cooked and noting the responses of each family member. I would also include parameters, or constraints. I might limit the fruits and vegetables to what’s in season and dole out a certain amount of Pop-Tarts, but only enough to forestall an open rebellion. I also would add a number of rules. This one likes meat, this one likes bread and pasta, this one drinks lots of milk and insists on spreading Nutella on everything in sight.

If I made this work a major priority, over many months I might come up with a very good model. I would have turned the food management I keep in my head, my informal internal model, into a formal external one. In creating my model, I’d be extending my power and influence in the world. I’d be building an automated me that others can implement, even when I’m not around.

There would always be mistakes, however, because models are, by their very nature, simplifications. No model can include all of the real world’s complexity or the nuance of human communication. Inevitably, some important information gets left out. I might have neglected to inform my model that junk-food rules are relaxed on birthdays, or that raw carrots are more popular than the cooked variety.

To create a model, then, we make choices about what’s important enough to include, simplifying the world into a toy version that can be easily understood and from which we can infer important facts and actions. We expect it to handle only one job and accept that it will occasionally act like a clueless machine, one with enormous blind spots.

Sometimes these blind spots don’t matter. When we ask Google Maps for directions, it models the world as a series of roads, tunnels, and bridges. It ignores the buildings, because they aren’t relevant to the task. When avionics software guides an airplane, it models the wind, the speed of the plane, and the landing strip below, but not the streets, tunnels, buildings, and people.

A model’s blind spots reflect the judgments and priorities of its creators. While the choices in Google Maps and avionics software appear cut and dried, others are far more problematic. The value-added model in Washington, D.C., schools, to return to that example, evaluates teachers largely on the basis of students’ test scores, while ignoring how much the teachers engage the students, work on specific skills, deal with classroom management, or help students with personal and family problems. It’s overly simple, sacrificing accuracy and insight for efficiency. Yet from the administrators’ perspective it provides an effective tool to ferret out hundreds of apparently underperforming teachers, even at the risk of misreading some of them.

Here we see that models, despite their reputation for impartiality, reflect goals and ideology. When I removed the possibility of eating Pop-Tarts at every meal, I was imposing my ideology on the meals model. It’s something we do without a second thought. Our own values and desires influence our choices, from the data we choose to collect to the questions we ask. Models are opinions embedded in mathematics.

Whether or not a model works is also a matter of opinion. After all, a key component of every model, whether formal or informal, is its definition of success. This is an important point that we’ll return to as we explore the dark world of WMDs. In each case, we must ask not only who designed the model but also what that person or company is trying to accomplish. If the North Korean government built a model for my family’s meals, for example, it might be optimized to keep us above the threshold of starvation at the lowest cost, based on the food stock available. Preferences would count for little or nothing. By contrast, if my kids were creating the model, success might feature ice cream at every meal. My own model attempts to blend a bit of the North Koreans’ resource management with the happiness of my kids, along with my own priorities of health, convenience, diversity of experience, and sustainability. As a result, it’s much more complex. But it still reflects my own personal reality. And a model built for today will work a bit worse tomorrow. It will grow stale if it’s not constantly updated. Prices change, as do people’s preferences. A model built for a six-year-old won’t work for a teenager.

This is true of internal models as well. You can often see troubles when grandparents visit a grandchild they haven’t seen for a while. On their previous visit, they gathered data on what the child knows, what makes her laugh, and what TV show she likes and (unconsciously) created a model for relating to this particular four-year-old. Upon meeting her a year later, they can suffer a few awkward hours because their models are out of date. Thomas the Tank Engine, it turns out, is no longer cool. It takes some time to gather new data about the child and adjust their models.

This is not to say that good models cannot be primitive. Some very effective ones hinge on a single variable. The most common model for detecting fires in a home or office weighs only one strongly correlated variable, the presence of smoke. That’s usually enough. But modelers run into problems—or subject us to problems—when they focus models as simple as a smoke alarm on their fellow humans.

Racism, at the individual level, can be seen as a predictive model whirring away in billions of human minds around the world. It is built from faulty, incomplete, or generalized data. Whether it comes from experience or hearsay, the data indicates that certain types of people have behaved badly. That generates a binary prediction that all people of that race will behave that same way.

Needless to say, racists don’t spend a lot of time hunting down reliable data to train their twisted models. And once their model morphs into a belief, it becomes hardwired. It generates poisonous assumptions, yet rarely tests them, settling instead for data that seems to confirm and fortify them. Consequently, racism is the most slovenly of predictive models. It is powered by haphazard data gathering and spurious correlations, reinforced by institutional inequities, and polluted by confirmation bias. In this way, oddly enough, racism operates like many of the WMDs I’ll be describing in this book.
  • WINNER
    Euler Book Prize
© Adam Morganstern
Cathy O’Neil is the author of the bestselling Weapons of Math Destruction, which won the Euler Book Prize and was longlisted for the National Book Award. She received her PhD in mathematics from Harvard and has worked in finance, tech, and academia. She launched the Lede Program for data journalism at Columbia University and recently founded ORCAA, an algorithmic auditing company. O’Neil is a regular contributor to Bloomberg Opinion. View titles by Cathy O'Neil

About

NEW YORK TIMES BESTSELLER • A former Wall Street quant sounds the alarm on Big Data and the mathematical models that threaten to rip apart our social fabric—with a new afterword
 
“A manual for the twenty-first-century citizen . . . relevant and urgent.”—Financial Times
 
NATIONAL BOOK AWARD LONGLIST • NAMED ONE OF THE BEST BOOKS OF THE YEAR BY The New York Times Book Review The Boston GlobeWired • Fortune • Kirkus Reviews • The Guardian • Nature • On Point
 
We live in the age of the algorithm. Increasingly, the decisions that affect our lives—where we go to school, whether we can get a job or a loan, how much we pay for health insurance—are being made not by humans, but by machines. In theory, this should lead to greater fairness: Everyone is judged according to the same rules.
 
But as mathematician and data scientist Cathy O’Neil reveals, the mathematical models being used today are unregulated and uncontestable, even when they’re wrong. Most troubling, they reinforce discrimination—propping up the lucky, punishing the downtrodden, and undermining our democracy in the process. Welcome to the dark side of Big Data.

Excerpt

1

BOMB PARTS
What Is a Model? 

It was a hot August afternoon in 1946. Lou Boudreau, the player-manager of the Cleveland Indians, was having a miserable day. In the first game of a doubleheader, Ted Williams had almost single-handedly annihilated his team. Williams, perhaps the game’s greatest hitter at the time, had smashed three home runs and driven home eight. The Indians ended up losing 11 to 10.

Boudreau had to take action. So when Williams came up for the first time in the second game, players on the Indians’ side started moving around. Boudreau, the shortstop, jogged over to where the second baseman would usually stand, and the second baseman backed into short right field. The third baseman moved to his left, into the shortstop’s hole. It was clear that Boudreau, perhaps out of desperation, was shifting the entire orientation of his defense in an attempt to turn Ted Williams’s hits into outs.

In other words, he was thinking like a data scientist. He had analyzed crude data, most of it observational: Ted Williams usually hit the ball to right field. Then he adjusted. And it worked. Fielders caught more of Williams’s blistering line drives than before (though they could do nothing about the home runs sailing over their heads).

If you go to a major league baseball game today, you’ll see that defenses now treat nearly every player like Ted Williams. While Boudreau merely observed where Williams usually hit the ball, managers now know precisely where every player has hit every ball over the last week, over the last month, throughout his career, against left-handers, when he has two strikes, and so on. Using this historical data, they analyze their current situation and calculate the positioning that is associated with the highest probability of success. And that sometimes involves moving players far across the field.

Shifting defenses is only one piece of a much larger question: What steps can baseball teams take to maximize the probability that they’ll win? In their hunt for answers, baseball statisticians have scrutinized every variable they can quantify and attached it to a value. How much more is a double worth than a single? When, if ever, is it worth it to bunt a runner from first to second base?

The answers to all of these questions are blended and combined into mathematical models of their sport. These are parallel universes of the baseball world, each a complex tapestry of probabilities. They include every measurable relationship among every one of the sport’s components, from walks to home runs to the players themselves. The purpose of the model is to run different scenarios at every juncture, looking for the optimal combinations. If the Yankees bring in a right-handed pitcher to face Angels slugger Mike Trout, as compared to leaving in the current pitcher, how much more likely are they to get him out? And how will that affect their overall odds of winning?

Baseball is an ideal home for predictive mathematical modeling. As Michael Lewis wrote in his 2003 bestseller, Moneyball, the sport has attracted data nerds throughout its history. In decades past, fans would pore over the stats on the back of baseball cards, analyzing Carl Yastrzemski’s home run patterns or comparing Roger Clemens’s and Dwight Gooden’s strikeout totals. But starting in the 1980s, serious statisticians started to investigate what these figures, along with an avalanche of new ones, really meant: how they translated into wins, and how executives could maximize success with a minimum of dollars.

“Moneyball” is now shorthand for any statistical approach in domains long ruled by the gut. But baseball represents a healthy case study—and it serves as a useful contrast to the toxic models, or WMDs, that are popping up in so many areas of our lives. Baseball models are fair, in part, because they’re transparent. Everyone has access to the stats and can understand more or less how they’re interpreted. Yes, one team’s model might give more value to home run hitters, while another might discount them a bit, because sluggers tend to strike out a lot. But in either case, the numbers of home runs and strikeouts are there for everyone to see.

Baseball also has statistical rigor. Its gurus have an immense data set at hand, almost all of it directly related to the performance of players in the game. Moreover, their data is highly relevant to the outcomes they are trying to predict. This may sound obvious, but as we’ll see throughout this book, the folks building WMDs routinely lack data for the behaviors they’re most interested in. So they substitute stand-in data, or proxies. They draw statistical correlations between a person’s zip code or language patterns and her potential to pay back a loan or handle a job. These correlations are discriminatory, and some of them are illegal. Baseball models, for the most part, don’t use proxies because they use pertinent inputs like balls, strikes, and hits.

Most crucially, that data is constantly pouring in, with new statistics from an average of twelve or thirteen games arriving daily from April to October. Statisticians can compare the results of these games to the predictions of their models, and they can see where they were wrong. Maybe they predicted that a left-handed reliever would give up lots of hits to right-handed batters—and yet he mowed them down. If so, the stats team has to tweak their model and also carry out research on why they got it wrong. Did the pitcher’s new screwball affect his statistics? Does he pitch better at night? Whatever they learn, they can feed back into the model, refining it. That’s how trustworthy models operate. They maintain a constant back-and-forth with whatever in the world they’re trying to understand or predict. Conditions change, and so must the model.

Now, you may look at the baseball model, with its thousands of changing variables, and wonder how we could even be comparing it to the model used to evaluate teachers in Washington, D.C., schools. In one of them, an entire sport is modeled in fastidious detail and updated continuously. The other, while cloaked in mystery, appears to lean heavily on a handful of test results from one year to the next. Is that really a model?

The answer is yes. A model, after all, is nothing more than an abstract representation of some process, be it a baseball game, an oil company’s supply chain, a foreign government’s actions, or a movie theater’s attendance. Whether it’s running in a computer program or in our head, the model takes what we know and uses it to predict responses in various situations. All of us carry thousands of models in our heads. They tell us what to expect, and they guide our decisions.

Here’s an informal model I use every day. As a mother of three, I cook the meals at home—my husband, bless his heart, cannot remember to put salt in pasta water. Each night when I begin to cook a family meal, I internally and intuitively model everyone’s appetite. I know that one of my sons loves chicken (but hates hamburgers), while another will eat only the pasta (with extra grated parmesan cheese). But I also have to take into account that people’s appetites vary from day to day, so a change can catch my model by surprise. There’s some unavoidable uncertainty involved.

The input to my internal cooking model is the information I have about my family, the ingredients I have on hand or I know are available, and my own energy, time, and ambition. The output is how and what I decide to cook. I evaluate the success of a meal by how satisfied my family seems at the end of it, how much they’ve eaten, and how healthy the food was. Seeing how well it is received and how much of it is enjoyed allows me to update my model for the next time I cook. The updates and adjustments make it what statisticians call a “dynamic model.”

Over the years I’ve gotten pretty good at making meals for my family, I’m proud to say. But what if my husband and I go away for a week, and I want to explain my system to my mom so she can fill in for me? Or what if my friend who has kids wants to know my methods? That’s when I’d start to formalize my model, making it much more systematic and, in some sense, mathematical. And if I were feeling ambitious, I might put it into a computer program.

Ideally, the program would include all of the available food options, their nutritional value and cost, and a complete database of my family’s tastes: each individual’s preferences and aversions. It would be hard, though, to sit down and summon all that informationoff the top of my head. I’ve got loads of memories of people grabbing seconds of asparagus or avoiding the string beans. But they’re all mixed up and hard to formalize in a comprehensive list.

The better solution would be to train the model over time, entering data every day on what I’d bought and cooked and noting the responses of each family member. I would also include parameters, or constraints. I might limit the fruits and vegetables to what’s in season and dole out a certain amount of Pop-Tarts, but only enough to forestall an open rebellion. I also would add a number of rules. This one likes meat, this one likes bread and pasta, this one drinks lots of milk and insists on spreading Nutella on everything in sight.

If I made this work a major priority, over many months I might come up with a very good model. I would have turned the food management I keep in my head, my informal internal model, into a formal external one. In creating my model, I’d be extending my power and influence in the world. I’d be building an automated me that others can implement, even when I’m not around.

There would always be mistakes, however, because models are, by their very nature, simplifications. No model can include all of the real world’s complexity or the nuance of human communication. Inevitably, some important information gets left out. I might have neglected to inform my model that junk-food rules are relaxed on birthdays, or that raw carrots are more popular than the cooked variety.

To create a model, then, we make choices about what’s important enough to include, simplifying the world into a toy version that can be easily understood and from which we can infer important facts and actions. We expect it to handle only one job and accept that it will occasionally act like a clueless machine, one with enormous blind spots.

Sometimes these blind spots don’t matter. When we ask Google Maps for directions, it models the world as a series of roads, tunnels, and bridges. It ignores the buildings, because they aren’t relevant to the task. When avionics software guides an airplane, it models the wind, the speed of the plane, and the landing strip below, but not the streets, tunnels, buildings, and people.

A model’s blind spots reflect the judgments and priorities of its creators. While the choices in Google Maps and avionics software appear cut and dried, others are far more problematic. The value-added model in Washington, D.C., schools, to return to that example, evaluates teachers largely on the basis of students’ test scores, while ignoring how much the teachers engage the students, work on specific skills, deal with classroom management, or help students with personal and family problems. It’s overly simple, sacrificing accuracy and insight for efficiency. Yet from the administrators’ perspective it provides an effective tool to ferret out hundreds of apparently underperforming teachers, even at the risk of misreading some of them.

Here we see that models, despite their reputation for impartiality, reflect goals and ideology. When I removed the possibility of eating Pop-Tarts at every meal, I was imposing my ideology on the meals model. It’s something we do without a second thought. Our own values and desires influence our choices, from the data we choose to collect to the questions we ask. Models are opinions embedded in mathematics.

Whether or not a model works is also a matter of opinion. After all, a key component of every model, whether formal or informal, is its definition of success. This is an important point that we’ll return to as we explore the dark world of WMDs. In each case, we must ask not only who designed the model but also what that person or company is trying to accomplish. If the North Korean government built a model for my family’s meals, for example, it might be optimized to keep us above the threshold of starvation at the lowest cost, based on the food stock available. Preferences would count for little or nothing. By contrast, if my kids were creating the model, success might feature ice cream at every meal. My own model attempts to blend a bit of the North Koreans’ resource management with the happiness of my kids, along with my own priorities of health, convenience, diversity of experience, and sustainability. As a result, it’s much more complex. But it still reflects my own personal reality. And a model built for today will work a bit worse tomorrow. It will grow stale if it’s not constantly updated. Prices change, as do people’s preferences. A model built for a six-year-old won’t work for a teenager.

This is true of internal models as well. You can often see troubles when grandparents visit a grandchild they haven’t seen for a while. On their previous visit, they gathered data on what the child knows, what makes her laugh, and what TV show she likes and (unconsciously) created a model for relating to this particular four-year-old. Upon meeting her a year later, they can suffer a few awkward hours because their models are out of date. Thomas the Tank Engine, it turns out, is no longer cool. It takes some time to gather new data about the child and adjust their models.

This is not to say that good models cannot be primitive. Some very effective ones hinge on a single variable. The most common model for detecting fires in a home or office weighs only one strongly correlated variable, the presence of smoke. That’s usually enough. But modelers run into problems—or subject us to problems—when they focus models as simple as a smoke alarm on their fellow humans.

Racism, at the individual level, can be seen as a predictive model whirring away in billions of human minds around the world. It is built from faulty, incomplete, or generalized data. Whether it comes from experience or hearsay, the data indicates that certain types of people have behaved badly. That generates a binary prediction that all people of that race will behave that same way.

Needless to say, racists don’t spend a lot of time hunting down reliable data to train their twisted models. And once their model morphs into a belief, it becomes hardwired. It generates poisonous assumptions, yet rarely tests them, settling instead for data that seems to confirm and fortify them. Consequently, racism is the most slovenly of predictive models. It is powered by haphazard data gathering and spurious correlations, reinforced by institutional inequities, and polluted by confirmation bias. In this way, oddly enough, racism operates like many of the WMDs I’ll be describing in this book.

Awards

  • WINNER
    Euler Book Prize

Author

© Adam Morganstern
Cathy O’Neil is the author of the bestselling Weapons of Math Destruction, which won the Euler Book Prize and was longlisted for the National Book Award. She received her PhD in mathematics from Harvard and has worked in finance, tech, and academia. She launched the Lede Program for data journalism at Columbia University and recently founded ORCAA, an algorithmic auditing company. O’Neil is a regular contributor to Bloomberg Opinion. View titles by Cathy O'Neil